

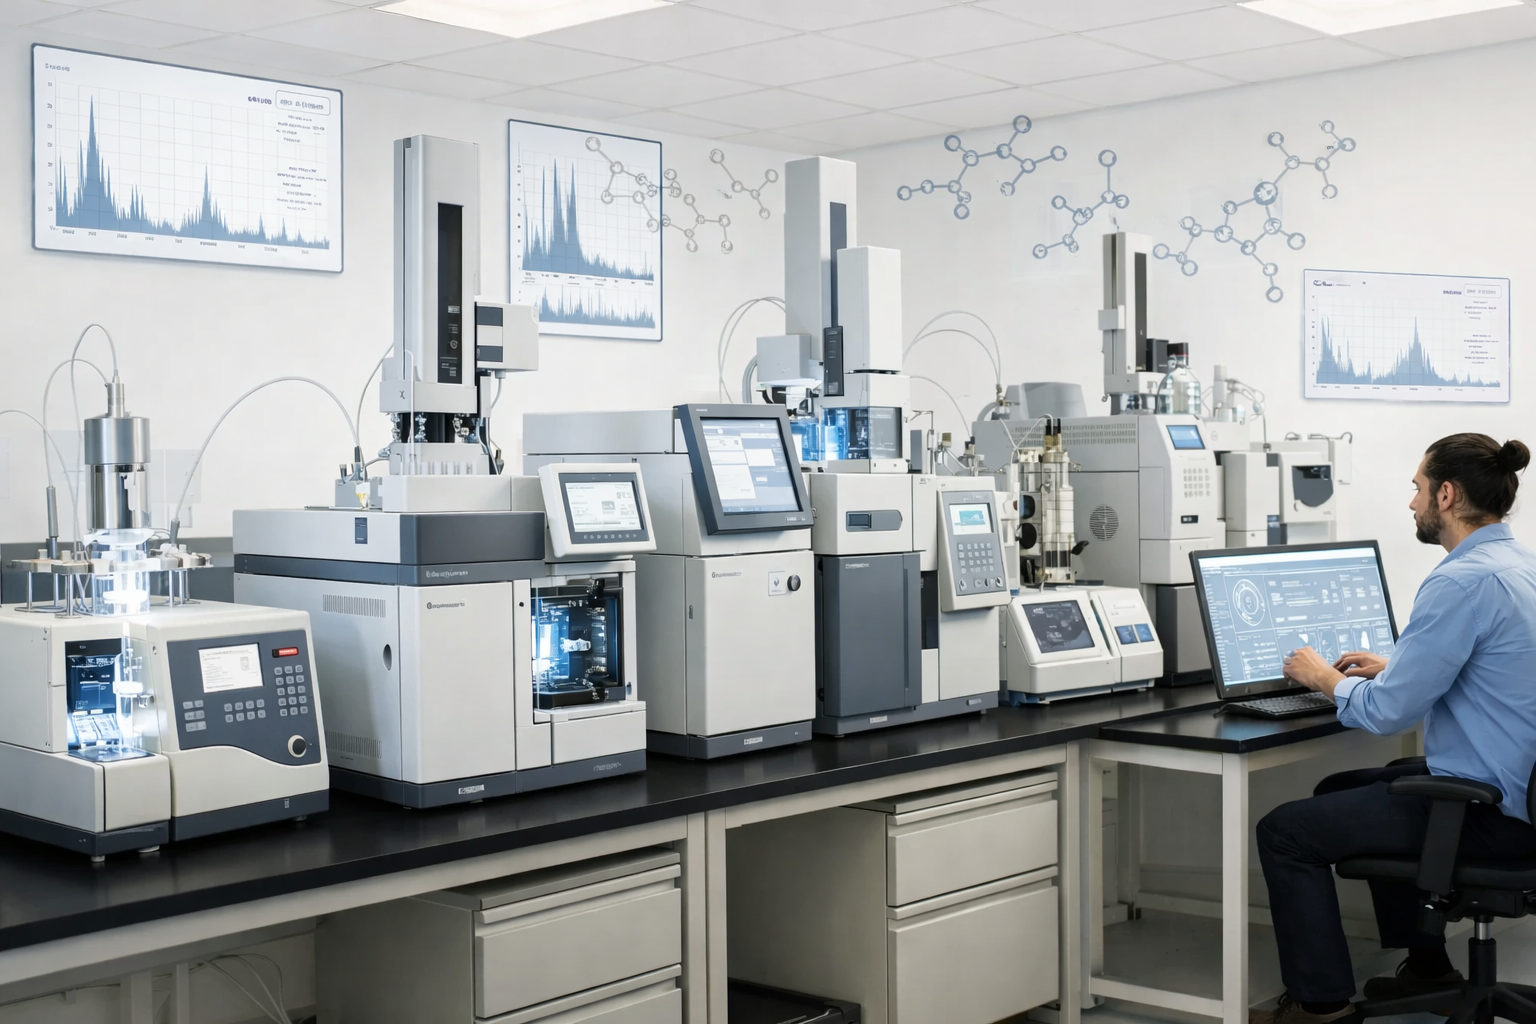
A mid-size analytical lab serving regulated industrial customers.
On paper: solid KPIs, passing audits, acceptable turnaround times.
In reality: constant pressure, late nights, and a quiet loss of credibility with senior customers.
The LIMS showed no red flags. The floor told a different story.
Management relied on:
What they didn’t see:
Nothing was broken enough to fail. Everything was degraded enough to hurt.
Not just formal reruns.
Included:
Finding:
For every 1 logged rerun, 3.4 invisible rework events occurred.
Runs that:
Finding:
18% of weekly runs fell into this gray zone — none visible to management.
Technicians rated instruments weekly:
Finding:
Several instruments rated “unreliable” for months while uptime stayed above 90%.
Availability ≠ trust.
They tracked how often systems sat in:
Finding:
The lab operated in a constant yellow state 62% of the time.
No alarms. Just erosion.
Measured indirectly via:
Finding:
Senior analysts were acting as living control systems.
Burnout was structural, not personal.
A major customer asked a simple question during renewal:
“Why do your results take longer to explain than to generate?”
Management couldn’t answer with data. That was the moment.
Within 90 days:
Most importantly:
LIMS told them what completed.
These metrics showed what it cost to complete.
Invisible work is still work.
Unlogged risk is still risk.
And a lab that’s always yellow is already late.
If your dashboards are calm but your people aren’t — measure that gap.

AI driven lap operations for regulated industries.Predictive diagnostics, service monetization, and compliance-grade telemetry for instrument OEMs.
BUILT FOR SECURE OEM DEPLOYMENT