

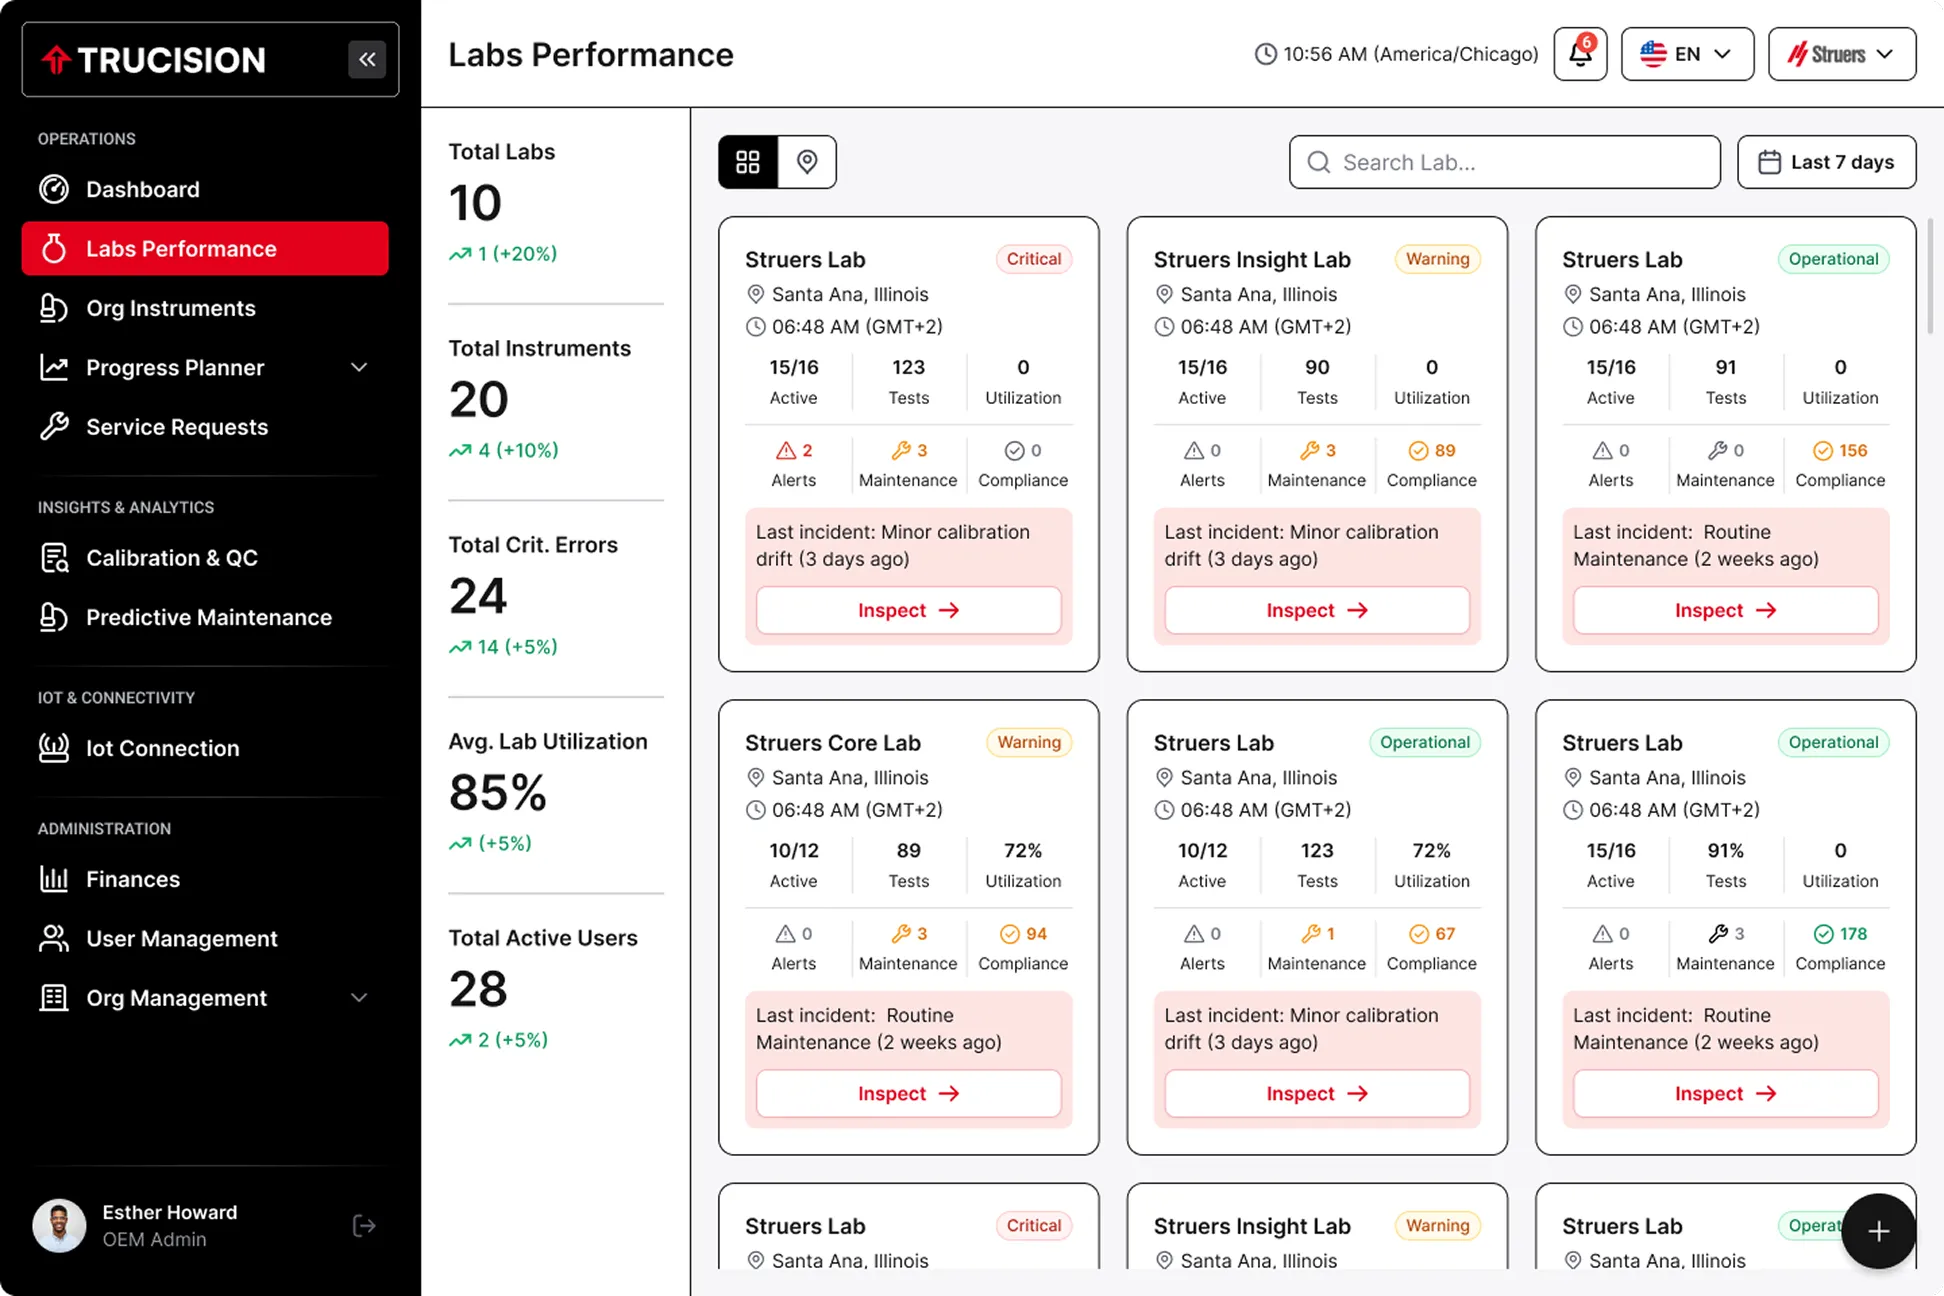
Key takeaways: In testing and QC labs, margin leaks through operational costs that rarely appear as line items: unplanned instrument downtime, retests, compliance overhead, over-servicing and idle capacity. Measuring these six levers turns operational improvement into a quantified EBITDA plan.
Lab P&Ls are deceptively simple: revenue from tests, costs for people, instruments, consumables and facilities. But much of the margin opportunity hides inside those categories, where it looks like normal cost of doing business. For PE owners, CFOs and lab directors, these are the six places to look.
When a critical instrument goes down, the cost isn't just the repair. It's lost test capacity, overtime to catch up, expedited shipping, rerouted samples and occasionally lost customers.
How to estimate it: hours of unplanned downtime × revenue per instrument-hour, plus overtime and expedite costs, plus the margin on any work lost.
Every retest consumes analyst time, consumables and instrument capacity without generating new revenue. Few labs track the rate consistently, which is exactly why it's a lever.
How to estimate it: retest rate × tests per year × (labor + consumables + instrument time per test).
Audit preparation sprints, manual evidence gathering and slow investigations tie up senior quality staff. Continuous readiness and faster investigations free that capacity.
How to estimate it: hours spent on audit prep, investigations and CAPA administration × fully loaded hourly cost.
Fixed calibration intervals and blanket service contracts often pay for work that isn't needed, while still missing drift on the instruments that need attention.
How to estimate it: compare as-found calibration results and service visit outcomes with the money spent. A long run of in-tolerance as-found results on low-risk instruments is a sign of over-servicing.
Some instruments sit idle while others become bottlenecks. Without utilization data, labs often request capex for capacity they already have elsewhere.
How to estimate it: utilization by instrument and site against demand, and capex requests that could be avoided by rebalancing work.
Unreliable turnaround erodes customer loyalty slowly, and the revenue impact shows up long after the cause.
How to estimate it: on-time delivery rate by customer, cross-referenced with customer revenue trends and complaints.
Consider a hypothetical lab with 40 critical instruments. If each loses an average of 30 unplanned hours a year, and each instrument-hour supports $200 of revenue, that's $240,000 of revenue capacity lost before counting overtime, expedites or customer churn. The numbers in your lab will differ, but the method is the same: make the hidden cost visible, then target the biggest lever first.
It varies, but unplanned downtime and retest rate are usually the largest and least measured.
Yes. Each lever above can be converted into labor hours, consumables, capacity or avoided capex, which roll up into EBITDA.
Visibility can come within weeks once instrument and quality data are connected. Savings follow as the top levers are addressed, often within the first two to three quarters.
Want to see where margin is leaking in your labs? Trucision connects instrument, LIMS and quality data to quantify each lever at record level. Book a 30-minute call.

AI driven lap operations for regulated industries.Predictive diagnostics, service monetization, and compliance-grade telemetry for instrument OEMs.
BUILT FOR SECURE OEM DEPLOYMENT